


#5 Medicare Part II: How it's working
In this post, we walk through the data and research on Medicare and Medicare Advantage so you can better understand the context behind the ongoing discussions in this space.

This is a continuation of a previous post on Medicare: How it works where we cover the terminology and mechanics associated with Medicare.
The need to fix Medicare might be one of the few issues that both sides of the political spectrum can agree on. With DOGE taking over news headlines, scrutiny over Medicaid and Medicare spending has come to the forefront of public attention. Previously, the Biden administration initiated a broad investigation by the DOJ into UnitedHealth that culminated in an investigation into the company’s Medicare billing practices recently (link).
Despite this, there is some disagreement about exactly how Medicare should be fixed, and I think this may be due to philosophical differences in what people think Medicare should achieve.
I could have called this post Medicare: Is it working? or perhaps even more precisely the real question that people have: Is the $1T+ that the US government spends on Medicare each year providing adequate health insurance to the older populations efficiently, whatever “adequate” and “efficiently” may mean.
In this post, I’ll break down the real question into a couple of more digestible sub-questions for us to walk through:
What is the trend of government spending on Medicare?
Why is enrollment in Medicare Advantage growing as a proportion of all Medicare enrollment?
What are the implications of increasing Medicare Advantage adoption?
The goal here is to go through some of the research or data that reflect how Medicare is working to provide more context to interested innovators and investors looking into AgeTech. I won’t be making any policy recommendations and hopefully this doesn’t read like an opinion piece.
Here, we will try to stick to the facts:
1. What is the trend of government spending on Medicare?
Apart from a small blip in the late 1990s (due to the Balanced Budget Act and efforts to curb fraud and abuse), government spending on Medicare has grown unabated.
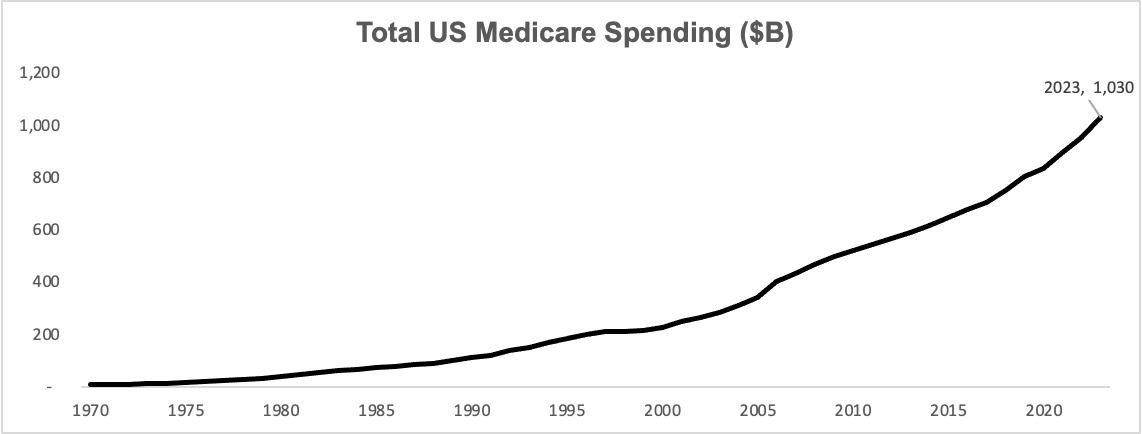
The primary drivers of this are healthcare inflation and demographic trends, as baby boomers enter Medicare enrollment age between 2010 - 2029.
Interestingly, Medicare spending growth rates, particularly on a per capita basis, slowed down in 2010 - 2019.
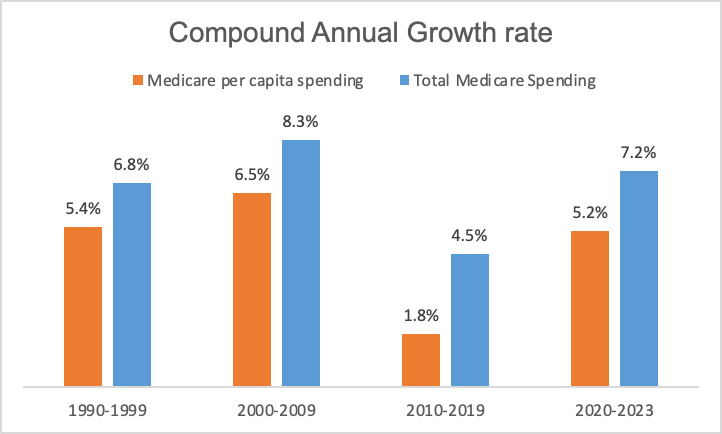
This appears to be driven by a few reasons:
Younger baby boomers entering the program lowered the average age of Medicare beneficiaries. Medicare spending increases with age, with the average Medicare spending for people aged 70 at $11.5k while the average Medicare spending for people aged 90 almost double that (link). As more baby boomers enroll in Medicare, the average spending per enrollee declines.
Lower than expected introduction of new brand name drugs and technology. In a letter to the Senate Budget Committee in 2023, the CBO described the main source of lower than expected Medicare spending in 2010s to be due to lower than expected spending in Part D (associated with prescription drugs), as existing brand-name drugs lost their patent protection and fewer introductions of new brand-name drugs were realized. CBO also cited a NBER working paper that suggested that there was less adoption of highly beneficial but more expensive technologies during this time as the focus shifted more towards cost-cutting technologies.
Better management of cardiovascular diseases through medication of risk factors was also cited by CBO as a reason for lower Medicare spending in 2010s. In 2015, direct medical costs associated with heart disease totaled $281B in the US, and 42% of Medicare beneficiaries aged 65 and over have at least one heart condition (link).
Regardless of this slowdown, Medicare spending has re-accelerated in the early 2020s, because:
COVID: The pandemic itself had mixed impacts on Medicare spending. On one hand, many patients delayed elective procedures and non-routine visits during the pandemic, which led to a slowdown of Medicare spending growth in 2020 (link). On the other hand, costs associated with vaccine administration and treatments, along with payment policy adjustments by Congress from 2020-2023, led to some upward pressure in Medicare spending. By 2023, healthcare services use had rebounded to utilization levels higher than pre-pandemic as people made up for missed visits and procedures from prior years. Medicare per enrollee spending grew 7.1% in 2023 compared to the previous year (link).
Rebound in growth in spending on retail prescription drugs: From 2020 to 2023, retail prescription drugs experienced the fastest growth in spending at 8.6%, following 3.3% average annual growth from 2010 to 2020 (link). Drivers likely include higher utilization, pricing, and the introduction of newly approved drugs (link). In 2020-2023, the FDA approved on average 48 drugs per year while in 2010-2019, the FDA approved only 37 drugs per year (link).
Another potential driver of increased Medicare spending is increased enrollment in MA plans. There is some debate as to whether or not MA is more or less expensive for the government, and there are studies that argue for each position. One study by Medicare Payment Advisory Commission (“MedPAC”), for example, argued that MA payments were 22% above that of Original Medicare once risk coding and favorable selection were taken into account (link).
What can not be disputed is that 2020-2023 was a high-growth period for Medicare Advantage, with total government spending in Medicare Advantage increasing from $361B in 2021 to $462B in 2023. This of course cannot solely be attributed to larger per capita spending, as there was an increase in percentage of enrollees that chose Medicare Advantage over Original Medicare during this time:
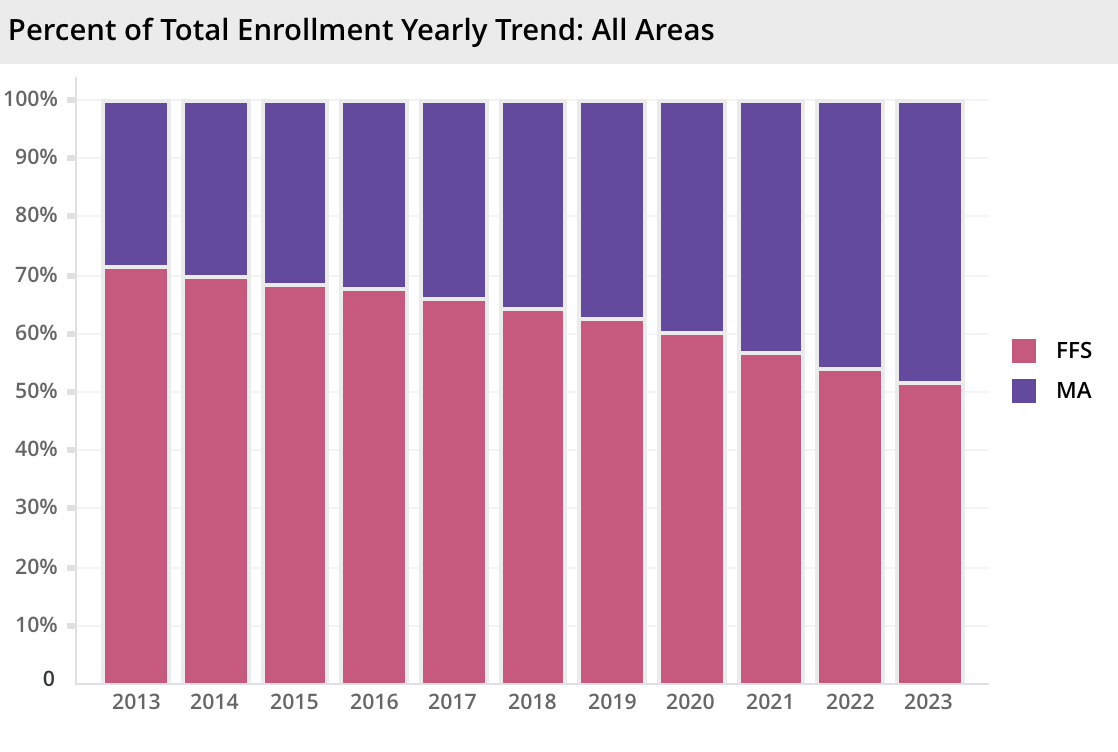
2. Why is enrollment in Medicare Advantage growing as a proportion of all Medicare enrollment?
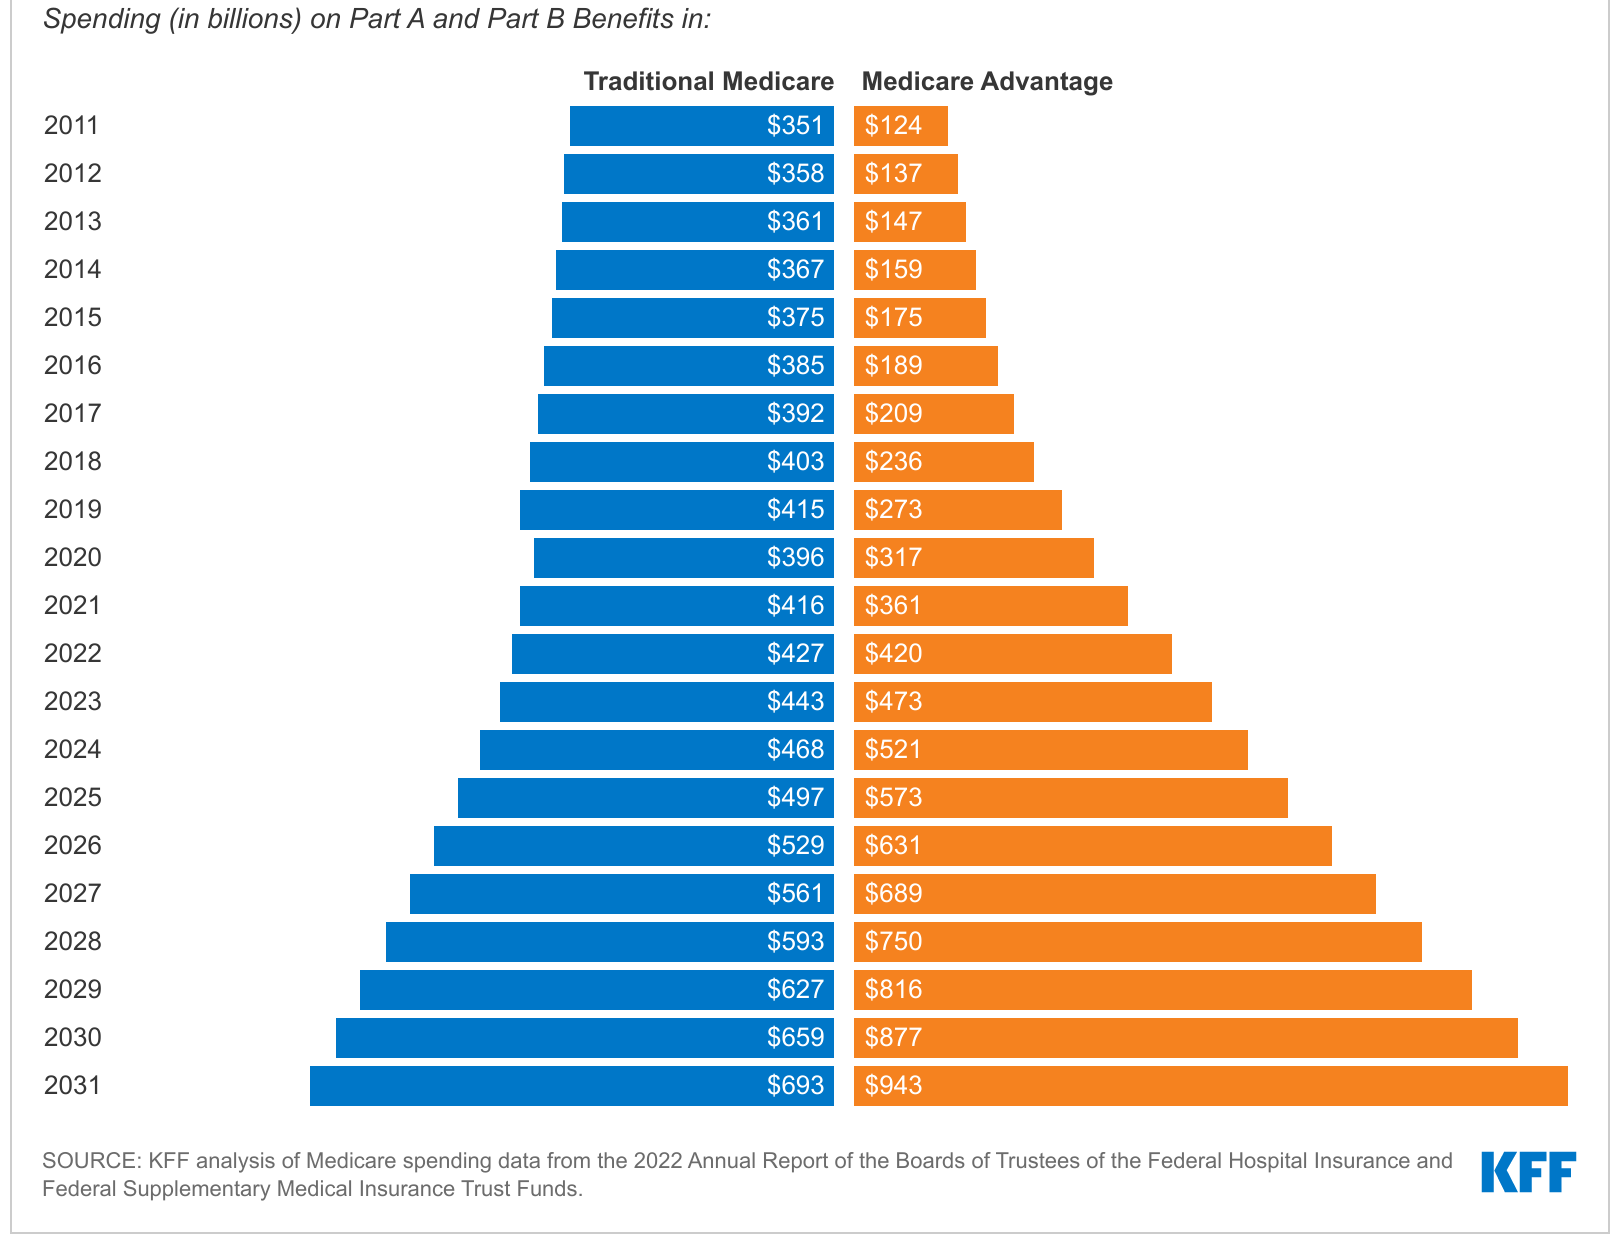
Apart from the annual growth of Medicare spending, another noticeable trend of the Medicare program is the increasing enrollment into Medicare Advantage programs as opposed to Original Medicare. 2023 marked the first year that Medicare spending surpassed that of Original Medicare, and this trend is only expected to continue.
Why choose Medicare Advantage: the enrollee perspective
To put it simply, Medicare Advantage appears to be a much better deal than Original Medicare, covering more at a cheaper price:
For Original Medicare: Enrollees pay at least a monthly premium of $185/month for Part B and $37/month for Part D (prescription drug coverage).
For Medicare Advantage: In 2024, three quarters (75%) of enrollees in MA plans with prescription drug coverage paid no premium other than the Medicare Part B premium, essentially getting Part D coverage for free (link). Additionally:
Most MA plans also offer supplemental benefits not covered by Original Medicare, such as vision, hearing and dental.
MA plans tend to have an out-of-pocket limit, which Original Medicare does not have absent a separate Medigap policy. This translated to 18-24% lower out-of-pocket spending in MA than Original Medicare in 2014-2019 (link).
What’s not accounted for in the description above are prior authorization practices and limited provider networks in MA plans which can negatively impact the enrollee experience (more on this later).
Why expand Medicare Advantage: the insurer perspective
Increasing adoption of Medicare Advantage is not simply because it appears to be a better deal for enrollees, but also because health insurers want to make it a better deal for enrollees.
Navigating through Medicare and MA plan selection can be challenging, and nearly one-third of beneficiaries age 65 and older say they turn to an insurance broker and agent. Brokers and agents are usually paid more in commissions by insurers to enroll people in MA plans compared to Medigap supplemental plans for Original Medicare (link).
This can only mean that MA plans are great business for insurers. And, they are, particularly for the big insurers. Annual earnings per MA member reached $562 in 2022, about double the earnings in Medicaid and 45% higher than in risk-based commercial plans. MA insurers with larger footprints, notably UnitedHealth, Humana, and CVS Health-owned Aetna, are particularly well-positioned to achieve good profitability due to scale from customer acquisition, pricing and benefits administration (link).
3. What are the implications of increasing Medicare Advantage adoption?
From an AgeTech innovator’s perspective, MA plans are generally a good thing as they are better early adopters of new tech. Due to clear cost savings objectives and less bureaucratic structures, MA plans can be more active and nimble in testing and incorporating in technological solutions compared to Original Medicare.
MA plans are also incentivized to stand out in a competitive market of MA plan providers and so are more willing to test innovative solutions to differentiate from competitors, whereas Original Medicare does not have that same incentives. In 2024, the average Medicare beneficiary had access to 43 MA plans (link).
Finally, because MA plans offer supplemental benefits that are not covered by Original Medicare, there is more room for partnerships for innovative companies working on supplementary services such as dental, vision, wellness programs, etc.
Despite these benefits to the innovation ecosystem, MA plans have been under scrutiny that a) they do not provide equivalent or better enrollee experience compared to Original Medicare and b) they are not more cost efficient from the perspective of the government and tax payers. This has historically led to political scrutiny and at times policy action to revamp the program.
a) Medicare Advantage and Beneficiary Experience
There are two key unique features of MA plans that can lead to a negative impact on patient experience:
Prior Authorization: MA insurers frequently require patients and providers to obtain prior authorization before receiving care. Nearly all Medicare Advantage enrollees (99%) are in plans that require prior authorization for some services, which is generally not used in Original Medicare. Prior authorization is most often required for relatively expensive services, such as skilled nursing facility stays (99%), Part B drugs (98%), inpatient hospital stays (acute: 98%; psychiatric: 93%) and outpatient psychiatric services (82%) and is rarely required for preventive services (6%) (link). This practice was criticized by a Senate report, which said:
“This Majority staff report reveals how Medicare Advantage insurers are intentionally using prior authorization to boost profits by targeting costly yet critical stays in post-acute care facilities. Insurer denials at these facilities, which help people recover from injuries and illnesses, can force seniors to make difficult choices about their health and finances in the vulnerable days after exiting a hospital.”
Network accessibility: MA enrollees can only access more limited provider networks, whereas virtually all (98%) of non-pediatric physicians participate in the Medicare program. This gap is expected to widen — according to a 2024 survey of 135 health systems CFOs, 16% were planning to stop accepting one or more Medicare Advantage plan in the next two years due to payment delays and prior authorization practices. 45% were considering the same but had not yet made a final decision (link).
Apart from these two differences in program design, from an outcomes perspective it’s difficult to comprehensively assess how Medicare Advantage impacts beneficiary experience and health outcomes as there are limited high-quality data sources to compare the two. While Medicare claims data are considered the gold standard of administration data, Medicare Advantage plans publish much less (link).
That being said, multiple studies do compare a subset of Medicare Advantage and Medicare outcomes across various dimensions. The results are mixed and generally suggest that MA and Original Medicare lead to generally similar outcomes though differ in some dimensions. Here are a few examples:
MA beneficiaries are shown to have higher rates of primary care visits, more access to preventative services (link) and receive fewer low-value services (link), which speak to improved efficiency.
However, MA beneficiaries are found to be less likely to receive treatment from high-quality home health agencies (link) and surgical cancer care (link).
b) Medicare Advantage and Cost Efficiency
As previewed earlier, the government may be paying more on a per capita basis to MA plans than Original Medicare. According to the Congressional Budget Office, this could be driven by the mechanics of how MA plans are compensated (link) (Note: I recommend reading Medicare: how it works for a refresher if the following doesn’t make sense)
First, about half of the people enrolled in Medicare Advantage plans reside in counties in which benchmarks, by design, are constructed to exceed estimated FFS (another name for Original Medicare) costs by 7.5 percent or by 15 percent.
Second, beneficiaries in Medicare Advantage have higher estimated risk scores, on average, than similar beneficiaries in Medicare FFS, in part because Medicare Advantage plans have an incentive to record more health conditions. That incentive exists because a plan's payment increases when the risk scores of its enrollees increase…
Third, quality bonuses apply only to Medicare Advantage plans—creating an additional cost that does not apply to Medicare FFS enrollees
Conclusion
Medicare and Medicare Advantage can be a powerful pathway to reimbursement for AgeTech innovators. Given this, it’s important that AgeTech Innovators are aware of the context that result in the dynamic environment these policies are situated in. Hopefully this intro post provides a good overview of the relevant research and data, and I’m sure we will revisit this topic at a future date.